Detecting power quality issues
June 7, 2023
By Fluke Corporation for the Blue Print
By Fluke Corporation for the Blue Print
|
Poor power quality comes at a cost. Monetary cost can come from power losses, but damaged assets could cost even more, including potential losses due to down time of a manufacturing process. Assets damaged by power quality events that cause increased heat will certainly shorten equipment life. To the untrained eye, problems in electrical distribution systems may not be recognizable as power quality problems. Knowing and recognizing the most common power quality symptoms and how to troubleshoot them is a first step in solving power quality issues.
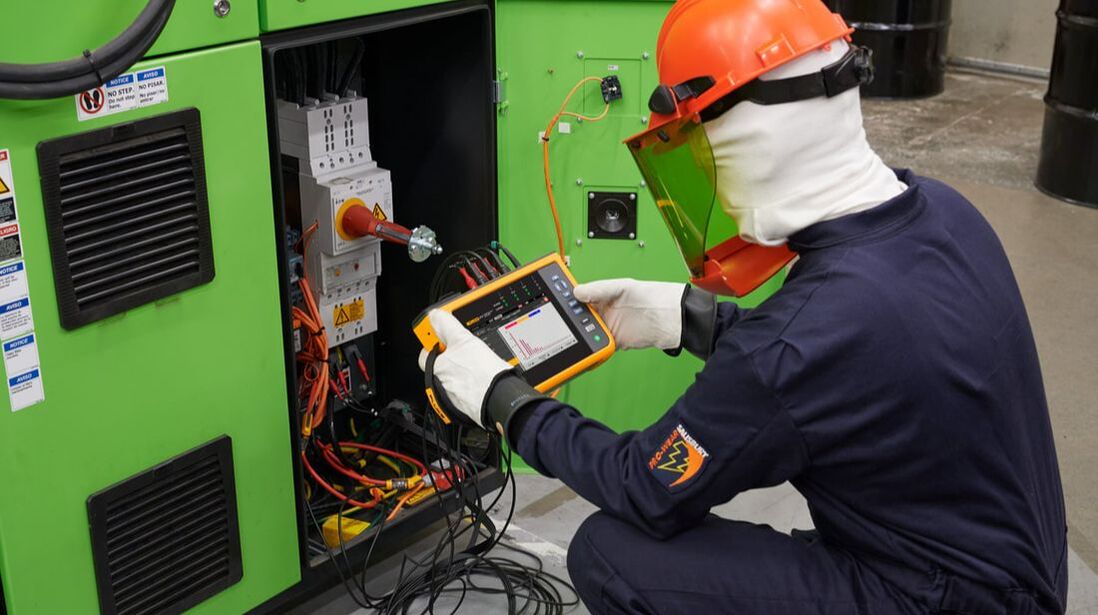
What tools do you need for the job?As with any troubleshooting task, you need the right tools. For power quality issues, those include knowledge and the right electrical test tools.
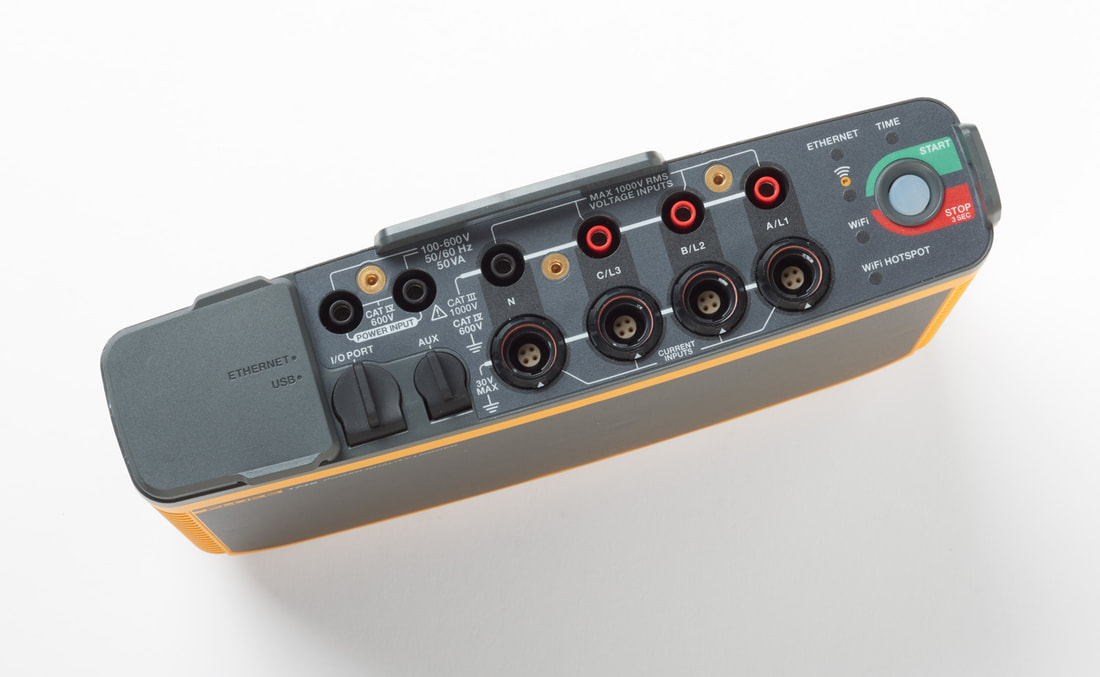
But first, you need a good set of up-to-date one-line diagrams of your facility. The one-line diagram identifies AC power sources, the loads they serve, and their ratings. It serves as your electrical road map to the facility and a guide for power quality studies. Once you’ve identified the assets to check, use a power quality analyzer to measure and record the specific parameters associated with power quality. Other tools, such as a data logger, thermal imager, infrared thermometer, and recording digital multimeter, can also aid in troubleshooting. What kinds of power quality problems will you find?Common power quality problems are grouped into two broad areas: voltage anomalies and harmonic distortion issues. Voltage anomalies can cause several problems, many easily corrected. The key is to spot the symptoms.
Voltage dips or sags Voltage dips or sags are responsible for up to 80 percent of all power quality issues. A dip or sag occurs when the system voltage drops to 90 percent or less of nominal system voltage for a half-cycle to one minute. Common symptoms of dips include incandescent lights dimming if the dip lasts more than three cycles, computer lockup, spurious shutdown of sensitive electronic equipment, data (memory) loss on programmable controls, and relay control problems. Detecting sags can be challenging because it’s difficult to predict when they will occur. To troubleshoot potential dip problems, begin by monitoring at the load where the dip symptoms first occur. Generally, an upstream event will be indicated by a drop in both voltage and current. A downstream or load dip in voltage would be indicated by an increased in current and a drop in voltage. Compare the time of the equipment’s operational failure to the time at which the voltage dip occurred; if there is not a correlation, the problem is most likely not voltage dip. Continue troubleshooting by monitoring farther upstream until the source is located. You can use the MIN/MAX function of a high-quality digital multimeter to detect single worst-case sags of 100 milliseconds or more while energizing the load. For suspected recurring dips, use the “Dips and Swells” trending feature on a high-performance power quality analyzer. If you need to “document” power quality events for a longer duration, event recorders are available that can record dips, swells, interruptions, transients, and frequency deviations for several weeks. Correct wiring and/or loading issues first. When your plant is in order, then you can pursue other sag-mitigating solutions, such as voltage regulators and constant voltage transformers. Voltage swells or surges
Voltage swells or surges occur only about half as often as dips. However, increases in system voltage for short periods up to a cycle or more can cause problems. As with all power quality problems, you must monitor parameters for a period of time, then observe and interpret. Symptoms of swells often include immediate failure of equipment, typically the power supply section of electronics. However, some equipment failures may not occur immediately, because voltage swells can occur over a period of time and prematurely break down components. If analysis of electronic equipment reveals faulty power supplies, monitor voltage trends on the feeders and branch circuits feeding this equipment. Where possible, compare failure rates of similar equipment operating on portions of systems known not to be experiencing swells. When analyzing power quality survey results, look for any sudden line-to-ground faults on a single-phase line. This type of fault causes the voltage to suddenly swell on the two non-faulted phases. Large plant loads suddenly dropping offline, and power factor correction capacitor switching, can also cause voltage swells. Voltage transients Voltage transients can cause symptoms ranging from computer lockups and damaged electronic equipment to flashover as well as damaged insulation on distribution equipment and motors. Transients, sometimes referred to as spikes, are substantial increases in voltage—but only for a matter of microseconds. Lightning strikes and mechanical switching are common causes. Equipment failure during a storm is often rightfully attributed to transients and no power quality monitoring is performed. Other causes of transients include switching of capacitors or capacitor banks, reenergizing systems after a power failure, switching of motor loads, turning off or on fluorescent and HID lighting loads, switching transformers, and sudden stoppage of certain equipment. For these transient conditions, monitor at the load and correlate equipment operational problems or failure with distribution system events. Normal arcing across contacts by interrupting large loads can be a cause of transients. Use the facility one-line to move the monitoring farther upstream in the distribution system until you find the source. Voltage interruptions Voltage interruptions can last anywhere from two to five seconds or more. The symptom is usually quite simple: the equipment stops operating. Interruptions for longer than five seconds are typically referred to as sustained interruptions. Most motor control circuits, and process control systems are not designed to restart even after a brief interruption of power. If a voltage interruption occurs when equipment is unattended, the cause of the equipment shutdown might not be properly identified. Only monitoring equipment and correlating the time of any power interruptions to the time of equipment issues will help identify voltage interruptions. Voltage unbalance
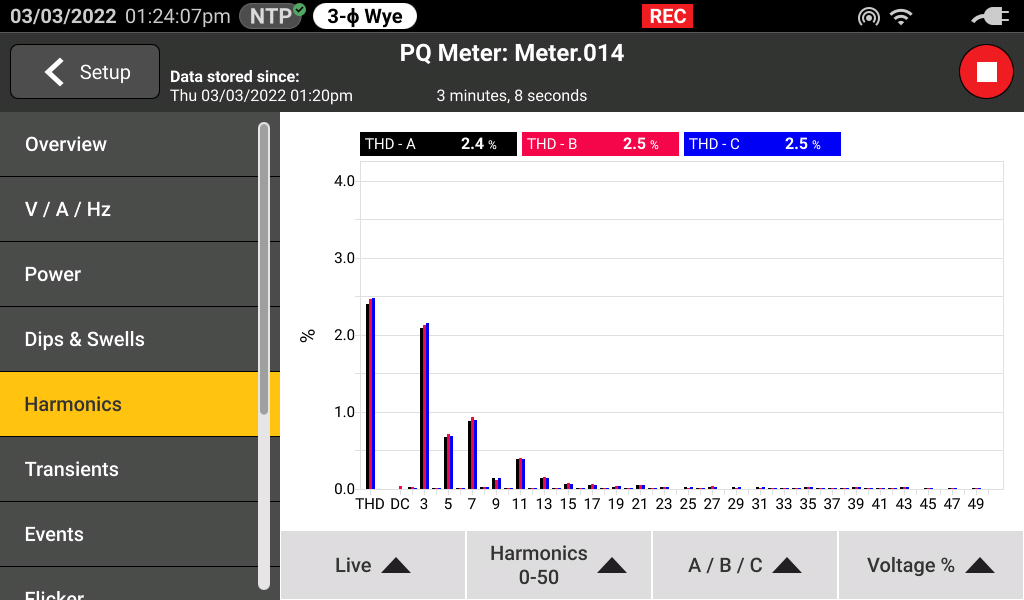
Voltage unbalance is one of the most common problems on three phase systems, and can result in severe equipment damage, yet it is often overlooked. For example, a voltage unbalance of 2.3 percent on a 230 V motor results in a current unbalance of almost 18 percent, causing a temperature rise of 30 °C. While a digital multimeter (DMM) and some quick calculations can be used for averaging voltage readings, a power quality analyzer provides the most accurate information about unbalance. Unbalance can occur at any point throughout the distribution system. Loads should be equally divided across each phase of a panelboard. Should one phase become too heavily loaded in comparison to others, voltage will be lower on that phase. Transformers and three-phase motors fed from that panel may run hotter, be unusually noisy, vibrate excessively, and even suffer premature failure. Monitoring over time is the key to capturing unbalance. Accurate, real-time unbalance measurements need a three-phase power quality analyzer to identify the problems. In a three-phase system, the maximum variation in voltage between phases should be no more than 2 percent (the Vneg % value on the analyzer), or significant equipment damage can occur. Harmonics Harmonics are voltages and currents whose frequency is said to be an integer multiple of the fundamental frequency. For example, the third harmonic is the voltage or current that is occurring at 180 Hertz (Hz) in a 60 Hz system (3 x 60 Hz = 180 Hz). These unwanted frequencies cause numerous symptoms, including overheating in neutral conductors and the transformers supplying these circuits. Reverse torque creates heat and efficiency losses in motors. When each harmonic is identified and compared to the fundamental 60 Hz frequency in this case, you can make decisions about the severity of each harmonic that appears in the system. Utilizing a power quality analyzer allows electricians and engineers the ability to view these harmonic frequencies individually for each phase. The most severe symptoms created by harmonics are typically the result of the harmonics distorting the fundamental 60 Hz sine wave found in facilities. This sine wave distortion results in improper operation of electronic equipment, spurious alarms, data losses, and what are often reported as “mysterious” problems.
|
|


